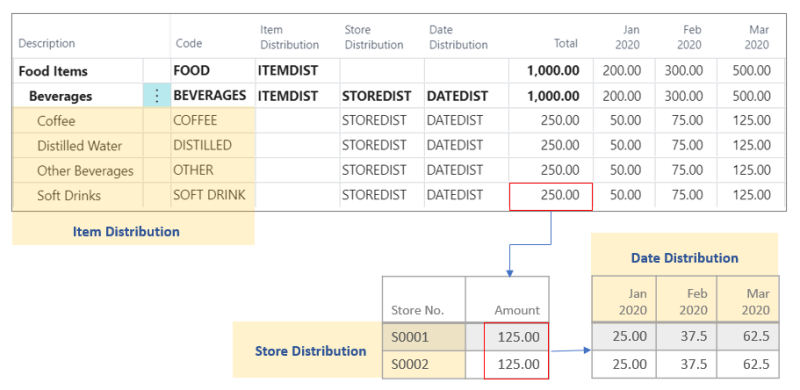
In Retail Sales Budgets, when the top-down approach is used, the budget values can be automatically distributed based on Budget Distribution Rules.
There are 3 types of distribution calculation:
- Equal - Distributes an amount equally between the number of elements.
- Proportional - Distributes an amount based on the distribution of the existing values.
- Curve - Distributes an amount based on manual weight assignment, or a distribution curve such as Lifecycle Curve or Allocation Rule.
These calculation types can be applied on 3 distribution types:
- Item - Applicable for Division, Item Category, Product Group, Item, or Item Hierarchy.
- Store - Applicable for Store.
- Date - Applicable for Date Period in Day, Week, Month, Quarter, or Year.

Equal distribution
The total amount can be distributed equally between each of the element based on the distribution type.
For example with Item distribution type, when a total amount of 40 is entered on the Product Group line (SOFT DRINK) consisting of 4 items, each element (item) will be distributed equally with the amount of 10:
| Description | Code | Total |
| Soft Drinks | SOFT DRINK | 40 |
| Cola | 30500 | 10 |
| Cherry Soda | 30510 | 10 |
| Orange Soda | 30520 | 10 |
| Sparkling Water | 30530 | 10 |
Proportional distribution
Proportional distribution lets you distribute the amount using the existing distribution ratio, based on the new total entered.
For example, assuming the existing distribution is as below:
| Description | Code | Total |
| Soft Drinks | SOFT DRINK | 100 |
| Cola | 30500 | 10 |
| Cherry Soda | 30510 | 20 |
| Orange Soda | 30520 | 30 |
| Sparkling Water | 30530 | 40 |
Changing the total on the SOFT DRINK line from 100 to 200 will distribute the changed amount to its lower level lines proportionally:
| Description | Code | Total |
| Soft Drinks | SOFT DRINK | 200 |
| Cola | 30500 | 20 |
| Cherry Soda | 30510 | 40 |
| Orange Soda | 30520 | 60 |
| Sparkling Water | 30530 | 80 |
Curve distribution
Curve distribution lets you distribute the amount based on predefined curve values.
The distribution types and their corresponding distribution curves are:
- Item - Manual weight assignment on the elements in Division, Item Category, Product Group, Item, or Item Hierarchy.
- Store - Manual weight assignment on stores, or based on the weights from Allocation Rule.
- Date - Manual weight assignment on date periods, or based on the weights from Lifecycle Curve.
For example, given a Date distribution type with 3 periods having the following percentage shares on a curve:
| Period | Weight | % Share |
| Period 1 | 2.00 | 20% |
| Period 2 | 3.00 | 30% |
| Period 3 | 5.00 | 50% |
When a total amount is entered with the curve distribution, each Period will get the distributed amount based on the curve's percentage share.
| Description | Code | Total | Period 1 | Period 2 | Period 3 |
| Cola | 30500 | 500 | 100 | 150 | 250 |
The total amount of 500 will be distributed to 100, 150 and 250 for each period respectively.
Calculation example
In this example, we have a sales budget with budget type Product Group spanning over 3 periods with 2 assigned stores.

The selected distribution rules and their calculation types are defined as below:
- Item Distribution = ITEMDIST - Equal
- Store Distribution = STOREDIST - Equal
- Date Distribution = DATEDIST - Curve
The distribution of the curve used in DATEDIST:
| Period | Weight | % Share |
| Period 1 | 2.00 | 20% |
| Period 2 | 3.00 | 30% |
| Period 3 | 5.00 | 50% |
By entering 1,000 in the Total field of the BEVERAGES line, the amount will be distributed down based on the distribution rules selected.
The total of 1,000 is distributed to the Product Groups COFFEE, DISTILLED, SOFT DRINK, and OTHER based on the selected Item Distribution ITEMDIST. With Equal type distribution, each Product Group is distributed with the amount of 250.
Next, the amount on each Product Group is distributed equally to 2 stores based on the Store Distribution STOREDIST. In this case, from the amount of 250, each Store is distributed with the amount of 125.
Lastly, for each Store under each Product Group, the amount is further distributed by the Date Distribution DATEDIST. For example on the line of Product Group SOFT DRINK for Store S0001, based on the total of 125, the Date Distribution uses the defined curve and assigns 25, 37.5 and 62.5 to the 3 periods respectively.
Tasks
The tasks listed below describe the setup steps for Budget Distribution Rules:
| To | See |
|---|---|
| Set up an Item Distribution Rule | How to: Set Up an Item Distribution Rule |
| Set up a Store Distribution Rule | How to: Set Up a Store Distribution Rule |
| Set up a Date Distribution Rule | How to: Set Up a Date Distribution Rule |
See Also